
Visual Paradigm (VP) is a fully integrated modeling, design, architecture, and project-management environment used by enterprises for software development, business process modeling, system architecture visualization, agile project management, and DevOps-aligned documentation.
It supports UML, BPMN, ArchiMate, ERD, SysML, Flowcharts, Customer Journey Mapping, Requirement Diagrams, UX Wireframes, and dozens of other diagramming and modeling frameworks. Known for its strong team collaboration, model synchronization, round-trip engineering, and database engineering features, VP has become a staple tool in large system development.
Key Capabilities of Visual Paradigm
1. Unified Modeling Language (UML)
Supports 13 UML diagram types including:
- Use Case
- Class Diagram
- Sequence Diagram
- Activity Diagram
- Component Diagram
- Deployment Diagram
- State Machine
- Communication Diagram
- Interaction Overview
- Package Diagram
2. Business Process Modeling (BPMN 2.0)
Includes process modeling, workflow automation, simulation, and process documentation.
3. Enterprise Architecture (ArchiMate 3.2)
Model Strategy, Motivation, Business, Application, Technology, and Implementation layers.
4. Database Engineering
- ERD modeling
- Forward & reverse engineering
- Patch generation for DB changes
5. Requirement Gathering & Traceability
- Use Case modeling
- User stories
- Requirements spec documents
- Traceability matrix
- Impact analysis
6. UX & Product Design
- Wireframes
- Storyboards
- Customer Journey Maps
- Personas
- Lifecycle process modeling
7. Agile & DevOps
- Scrum process management
- Kanban
- Project management
- DevOps pipelines (via integration)

Use Case Diagram
Sample Use Case: Online Food Delivery Platform
Actors:
- Customer
- Restaurant Admin
- Delivery Driver
Use cases: - Place Order
- Track Order
- Update Menu
- Assign Delivery
Steps in Visual Paradigm
- Open Diagram → New → UML → Use Case Diagram
- Drag actors to left side panel.
- Drag Use Case Oval shapes.
- Connect actors to use cases using Association tool.
- Add include/extend relationships as needed.
- Add descriptions in Use Case Details Pane.
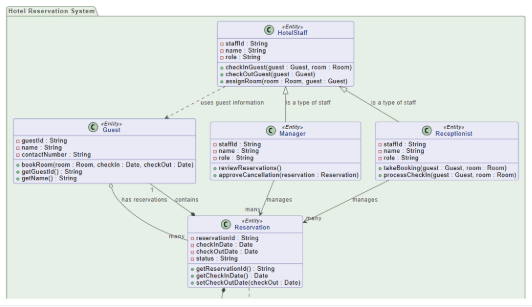
2. Class Diagram
Sample Use Case: E-Commerce Inventory Management System
Classes:
- Product
- Category
- Inventory
- Supplier
Relationships:
- Product belongs to Category (many-to-one)
- Product has Inventory
- Supplier supplies Product
Steps
- New → UML → Class Diagram
- Add Class shapes.
- Define attributes & methods inside classes.
- Add relationships:
- Associations
- Inheritance
- Aggregation/Composition
- Configure multiplicities (1, *, 0..1).
- Use Instant Reverse to generate diagram from code if needed.
3. Sequence Diagram
Sample Use Case: Payment Processing
Flow:
- User initiates checkout
- System validates cart
- Payment gateway processes transaction
- System confirms order
Steps
- New → UML → Sequence Diagram
- Add lifelines (User, Web App, Payment Gateway).
- Add messages (arrow tool) representing calls/events.
- Add return messages.
- Group with activation bars.
4. Activity Diagram
Sample Use Case: Employee Onboarding Process
Activities:
- HR initiates onboarding
- Employee submits documents
- System performs background check
- Manager assigns equipment
Steps
- New → UML → Activity Diagram
- Add Start Node.
- Place Action Nodes for activities.
- Add Decision/Merge nodes.
- Add End Node.
- Use Swimlanes for HR, Employee, System.
5. BPMN Process Diagram
Sample Use Case: Loan Approval Workflow
Pools/Lanes:
- Applicant
- Loan System
- Underwriting Team
Flow:
- Submit Application
- System validates
- Underwriter reviews
- Approve/Reject
Steps
- New → BPMN Diagram
- Create Pool & Lanes.
- Add Start Event & Tasks.
- Insert Gateways for decision logic.
- Add Message Flows between pools.
- Connect processes end-to-end.
6. ArchiMate Enterprise Architecture Diagram
Sample Use Case: Modernizing Legacy Banking Application
Layers:
- Business Process: Customer Onboarding
- Application Layer: CRM, KYC Service
- Technology Layer: Kubernetes, API Gateway
- Motivation: Compliance Drivers
Steps
- New → ArchiMate Diagram
- Add elements from Business, Application, Technology layers.
- Use relationships (serving, triggering, flow).
- Add motivation elements (drivers, goals, requirements).
- Validate model using ArchiMate consistency check.
7. ERD (Database Entity-Relationship Diagram)
Sample Use Case: Healthcare Patient Records
Entities:
- Patient
- Visit
- Physician
- Prescription
Steps
- New → Database Modeling → ERD
- Add Entities.
- Define attributes & primary keys.
- Add Relationships (1-to-many, many-to-many).
- Use Generate DB Schema tool.
- Export SQL or sync with database.
8. State Machine Diagram
Sample Use Case: Smart Home Door Lock
States:
- Locked
- Unlocking
- Unlocked
- Auto-Lock
Transitions:
- PIN Entered
- Timeout
- Manual Lock
Steps
- New → UML → State Machine Diagram
- Add initial state.
- Add states for each device mode.
- Connect transitions with events.
- Add guards/conditions.
9. Customer Journey Map
Sample Use Case: Airline Booking Experience
Phases:
- Search flight
- Book ticket
- Check-in
- Boarding
Touchpoints:
- Website
- Mobile App
- Airport Kiosk
Steps
- New → Customer Journey Map
- Define stages.
- Add touchpoints, customer actions, emotions.
- Add pain points and opportunities.
- Export journey report.
10. Wireframe / UX Mock-up
Sample Use Case: Mobile Banking App
Screens:
- Login
- Dashboard
- Transfers
- Transaction History
Steps
- New → Wireframe Diagram
- Choose template (Mobile, Web).
- Drag standard UI components (buttons, lists, forms).
- Link screens for navigation.
- Export prototype.
11. Component Diagram
Sample Use Case: Microservices Architecture
Components:
- API Gateway
- Auth Service
- Billing Service
- Notification Service
Steps
- New → UML → Component Diagram
- Add components & interfaces.
- Connect using dependency links.
- Add deployment notes if needed.
12. Deployment Diagram
Sample Use Case: Kubernetes-Based SaaS Deployment
Nodes:
- Web Server Pod
- API Server
- Database Cluster
- Redis Cache
Steps
- New → Deployment Diagram
- Add nodes & artifacts.
- Add communication paths.
- Add container elements if needed.
JSON → Reverse Engineer to Class Diagram → Convert Class Diagram into Dependency Diagram / ERD / Map View
Take a JSON file → Auto-generate diagram → Show interdependencies across entities
You can generate any of these:
- Class Diagram (best for interdependency)
- ER Diagram
- Generic Dependency Map
- Data Model Diagram
METHOD: JSON → CLASS DIAGRAM → DEPENDENCY DIAGRAM IN VISUAL PARADIGM
STEP 1 — Prepare Your JSON File
Your JSON should have clear object structure. Example:
{
  "user": {
    "userId": 1,
    "profile": {
      "name": "John",
      "email": "john@example.com"
    },
    "orders": [
      {
        "orderId": 1001,
        "amount": 250.50
      }
    ]
  }
}
Visual Paradigm uses:
- JSON objects → Classes
- JSON arrays → One-to-many relationships
- Nested objects → Composition
STEP 2 — Open Visual Paradigm and Start Instant Reverse
- Open Visual Paradigm
- Go to the top menu:
Tools → Code → Instant Reverse… - Select JSON as your source
- Click Next
- Upload your JSON file
VP scans the JSON and converts it into a model.
STEP 3 — VP Automatically Generates a Class Diagram
Visual Paradigm now creates a Class Diagram representing your JSON:
Example structure:
User
 ├── Profile
 └── Order *
Interdependencies appear automatically via:
- Associations
- Composition
- Multiplicity (1, *, 0..1)
STEP 4 — Clean Up or Restructure the Auto-Generated Diagram
You can enhance the interdependency visualization:
Recommended actions:
- Right-click → Layout → Diagram Layout → Automatic Layout
- Group classes into logical packages
- Rename relationships for clarity
- Add color coding for categories or domains
Now your Class Diagram shows all entity interdependencies derived from the JSON.
STEP 5 — Optionally Convert to an ERD (if data-model focused)
- Select all Classes
- Right-click → Tools → Transform → Class Diagram to ERD
- VP auto-detects:
- PKs
- FKs
- One-to-many or one-to-one relationships
This produces a clean ERD diagram, ideal for data-model interdependency visualization.
STEP 6 — Generate a Dependency Diagram (Visual Dependency Map)
If your focus is interdependency between modules/nodes, Visual Paradigm provides a dependency map.
Steps
- In the Model Explorer, select all the generated classes
- Right-click → Visualize → Visual Dependency Mapping
- Choose your preferred visualization:
- Matrix View
- Circular Dependency Map
- Graph View
- Layered View
VP will render:
- Nodes (each class/entity)
- Edges showing relationships from the JSON structure
STEP 7 — Export the Diagram (Optional)
You can export the visual dependency diagram to:
- PNG
- SVG
- Animation GIF (for process diagrams)
Steps:
- Right-click the diagram background
- Export Diagram As…